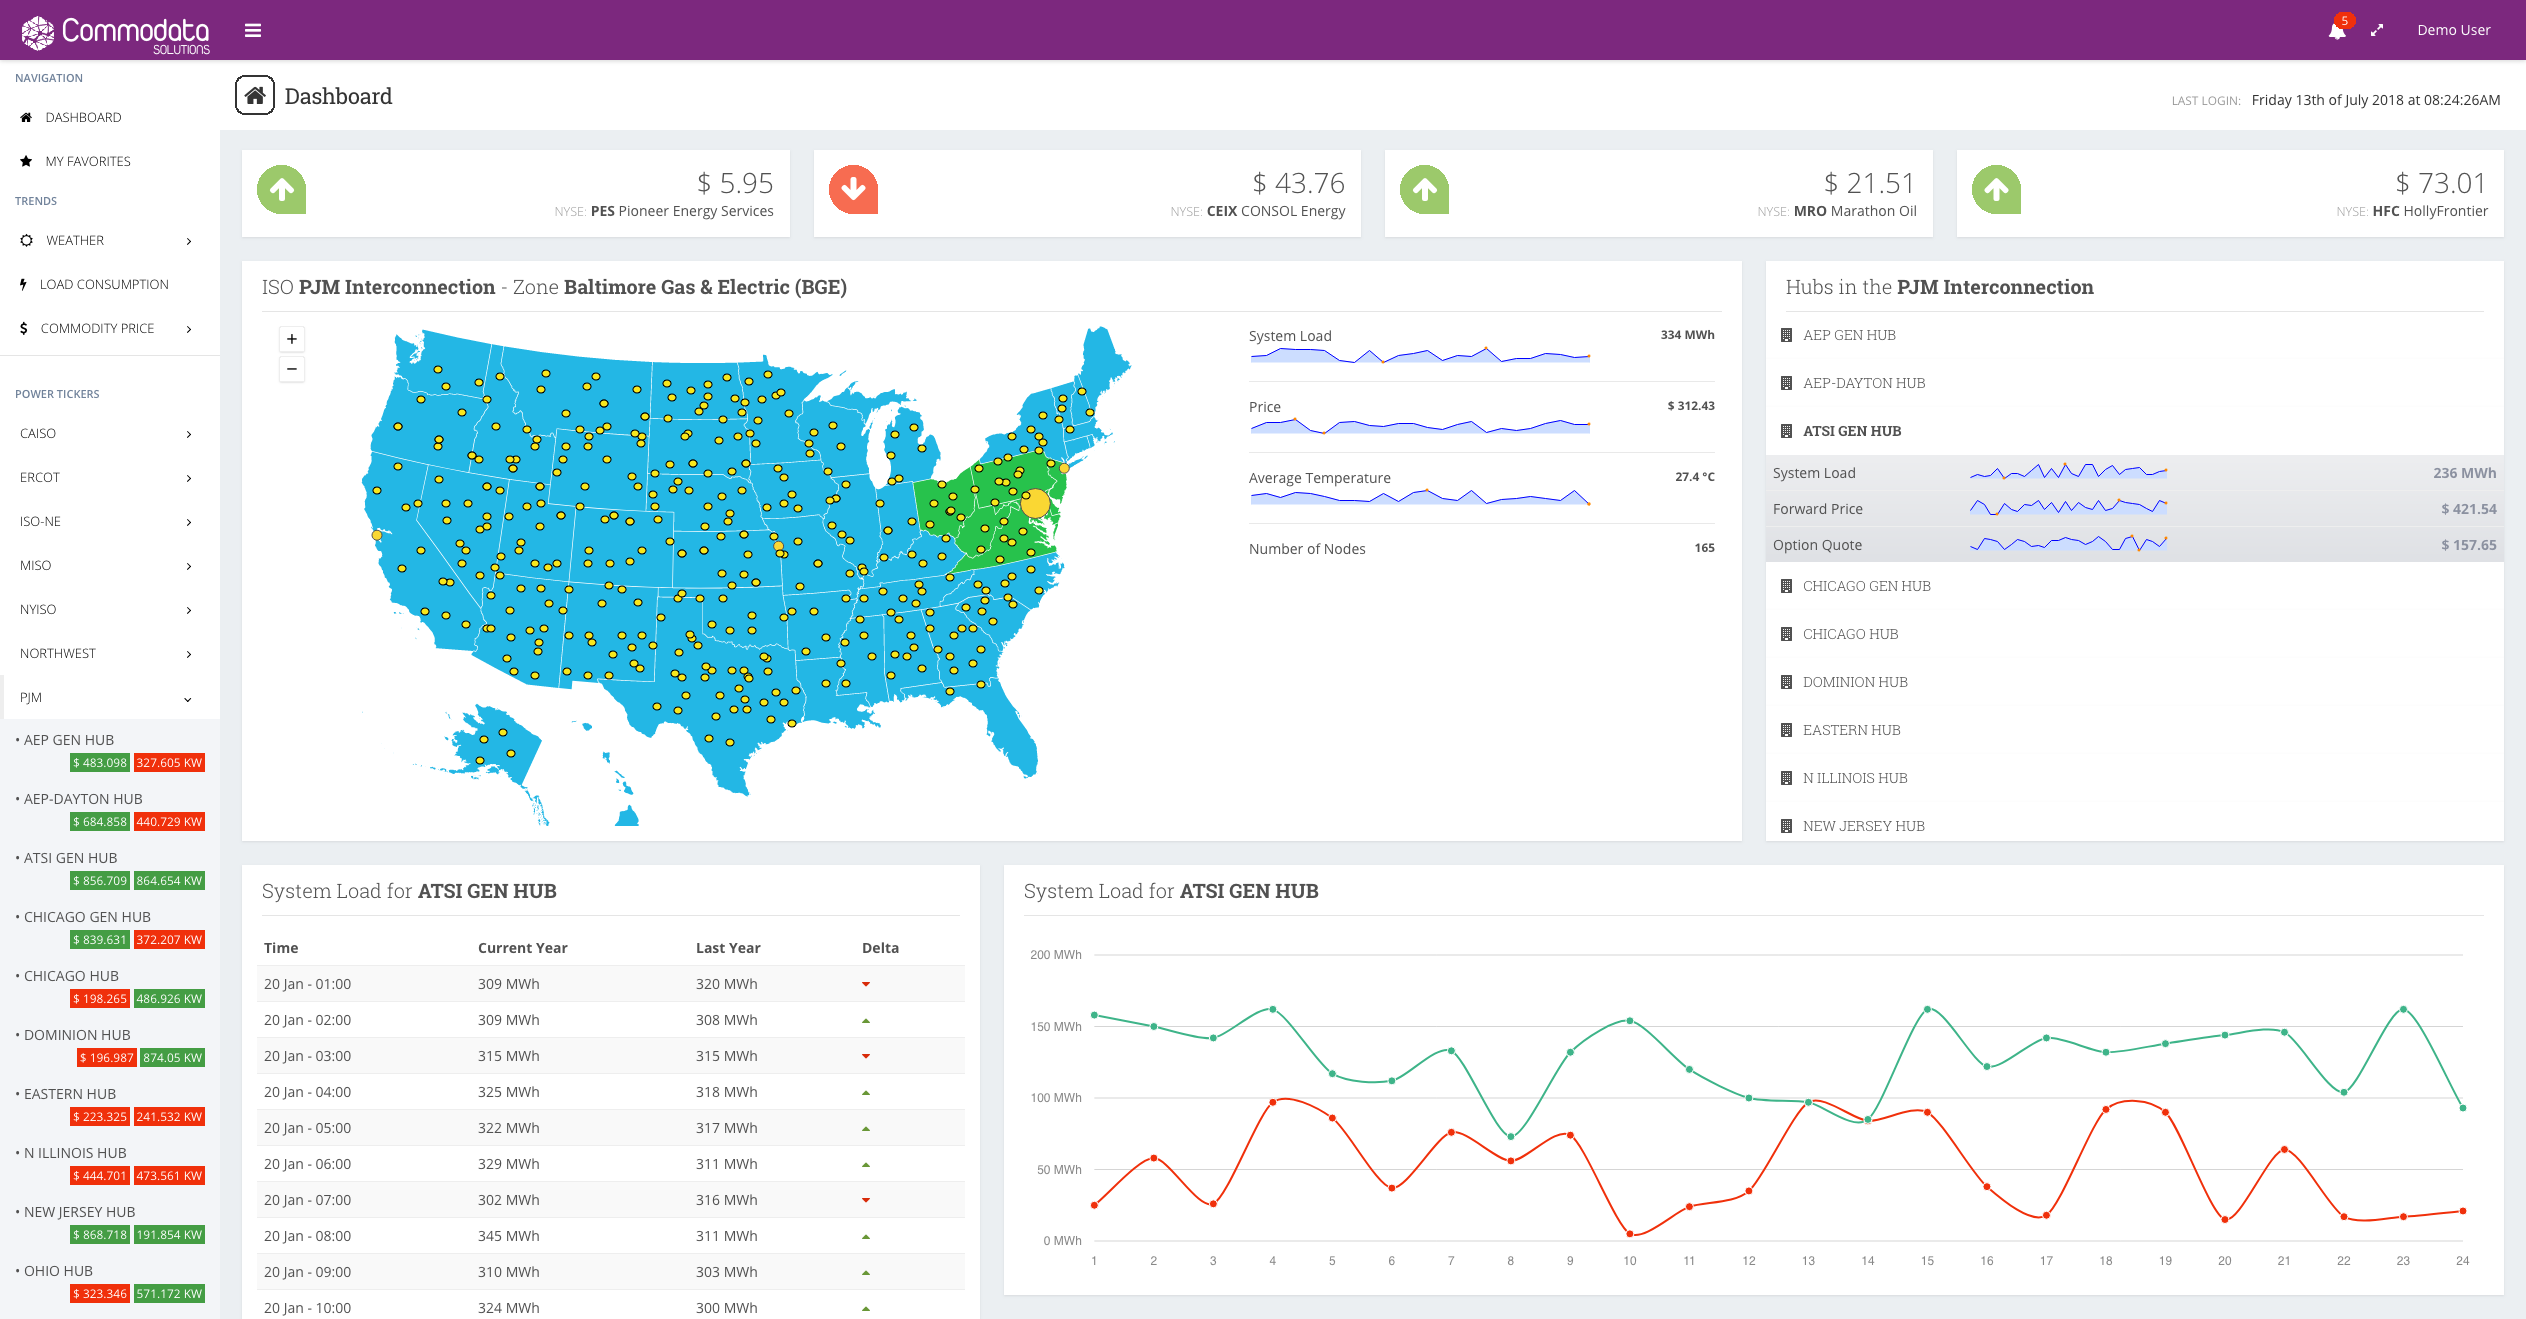
Commodata AGORA streamlines access to data for over 3,789 locations in North America.
Our powerful analytic tools allow you to plot historic data directly on our application. You can also choose to download the information in Excel / CSV files or integrate our API into your existing software platforms via web hooks.
Access our web application for the trends you are mostly interested in. Data is added on a daily basis so your view will always be up to date. You can customize your dashboard and save your favorite trends for future ease of access.
Enterprise and Corporate plans also offer users to share favorite trends and views across groups. Data can be accessed on the go as well with our fully responsive user interface.
You can integrate Commodata AGORA’s data directly into your existing corporate software ecosystem using our powerful APIs. Our REST-ful interface is well documented and deliver the data in a variety of formats.
If you would like further assistance for data integration, please contact us. Our software engineers and consultants can lend a hand to your IT team or deliver an entire custom solution for you.
Our weather telemetries are offered at an hourly interval. Our load consumption is refreshed every 15 minutes. Commodity prices are typically offered at daily intervals.
We update most of our data on a daily basis. Load consumptions are updated every 15 minutes.
Yes. Please refer to our Pricing page for details about our tiered plans and the type of support they include.
Yes. All searched and generated trends can be exported to Excel by a click of a button. We also offer Excel files with integrated hooks to bypass logging to our application.
Get started with a commitment-free demonstration by one of our product specialists.
REQUEST DEMO